
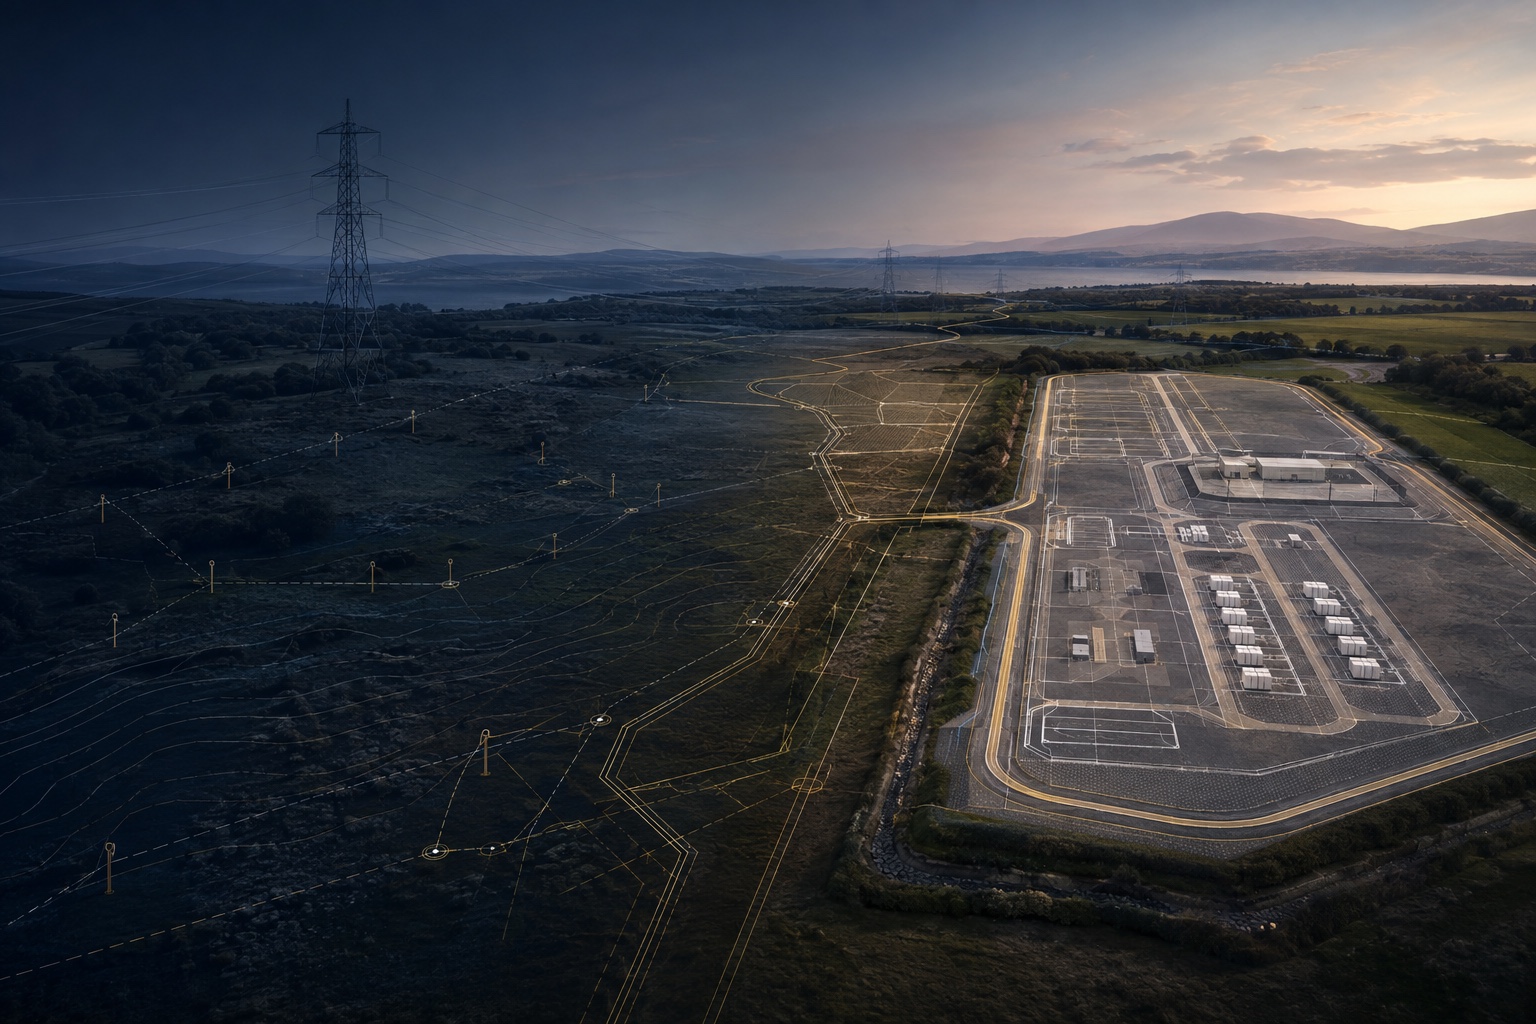
Public disclosures show how development expenditure differs from the price of ready-to-build battery projects in Germany and Italy. These are different measures, not directly comparable valuations. Here is what the evidence can—and cannot—tell a project team assessing the route to RTB, including in Switzerland.
Published greenfield and early-stage development references cover origination, land control, grid work, permitting and engineering. They range from below €10,000/MW in one listed-developer disclosure to €40,000–60,000/MW in a German advisory benchmark. Published RTB transactions put a price on project rights at a later stage, but use different projects, currencies, durations and cost bases.[6, 11]
Securing land, permits and a workable grid position creates a more complete development package. The transaction evidence shows that such rights can be priced; it does not establish the net margin between their sale price and the full cost of creating them. That assessment must include unsuccessful sites, elapsed time, transaction scope and remaining obligations.
RTB prices reflect project maturity, rights and risk allocation. The disclosed sample does not establish a universal premium over total development cost or a stable multiple.
Germany's connection queue illustrates the competition for grid access. The Bundesnetzagentur reported around 400 GW of planned capacity in storage connection requests submitted in 2024. Separately, network operators approved around 3,800 applications from 2024 and earlier years, representing about 25 GW. These figures describe different application cohorts; they do not measure how a secured connection affects a project's transaction price.[1]
| Profile | Indicative range | Basis |
|---|---|---|
| Greenfield development | €40–60k/MW | Advisory DevEx benchmark for an illustrative German 60 MW / 120 MWh system |
| RTB project rights | US$50–170k/MW | Developer-premium range reported by Enerdatics in the source currency |
| Disclosed RTB transaction | c. €115.6k/MW | Döllnitz RTB SPV (63 MW / 252 MWh), disclosed consideration ÷ power capacity |
The German benchmarks combine an advisory development-cost estimate, disclosed transactions, company reporting and independent transaction analysis. Currencies are retained as published rather than converted.[2, 3, 4, 5, 11]
Italian RTB pricing is tracked quarterly through nTeaser transaction data and has moved materially in recent quarters, with reported medians declining from Q4 2025 to Q1 2026 amid regulatory uncertainty. The underlying greenfield development cost, disclosed by at least one listed developer, remains well below even the lower end of that range.[6, 7, 8, 9, 10]
| Profile | Indicative range | Basis |
|---|---|---|
| Greenfield development | Below €10k/MW | Publicly disclosed developer cost reference |
| RTB, Q1 2026 | €15–48k/MW, median €37.5k/MW | nTeaser quarterly transaction data |
| RTB, Q4 2025 | €19.5–55k/MW, median €44k/MW | nTeaser quarterly transaction data |
The disclosed prices reflect completed development work and the rights transferred, but do not prove that every greenfield project costs less to develop than an equivalent RTB acquisition. Land agreements can fail, connection applications can be rejected or delayed, and permits can stall. For each site, distinguish work already completed from the checks, decisions and permissions still outstanding.
A staged review makes those open points visible before the next development step. It can identify unresolved land, grid or planning constraints early, document why a site progresses or pauses, and show what evidence is still needed. This is a way to manage development work—not a forecast that a particular share of sites will reach RTB.
Some constraints are specific to a site, such as land rights or local planning requirements. Others, including grid-connection capacity and regulatory changes, can affect many projects in the same jurisdiction. A project review should separate site-level evidence from assumptions shared across a market, and verify both with the relevant landowners, network operators and authorities.
Published transaction figures are context, not a universal benchmark. Their practical use depends on the decisions and evidence relevant to each party.
At each stage, record the work completed, the evidence obtained and the open land, grid and permitting questions. This makes the next development step—and the information needed to take it—clearer.
A credible path towards RTB depends on site-specific land, grid and permitting evidence. The practical questions are which rights, responsibilities and milestones should be addressed in a lease or co-development agreement.
When reviewing an RTB or near-RTB project, distinguish completed work from outstanding approvals, network-operator responses, land rights and delivery obligations. Published transaction references do not establish the status or suitability of an individual project.
Source corrections and excerpts checked on 7 October 2026. Original-language fragments are labelled; source dates and scope are stated below.
63 MW / 252 MWh
DEV Cost < 10,000 EUR / MW
EUR 40-60k
Header image: AI-generated illustration for this analysis, not a photograph of an existing project or evidence of a specific site, connection or approval.